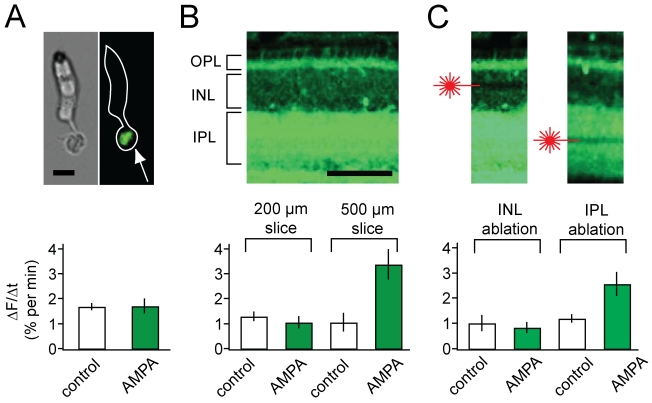
Figure 3. Determining the cellular locus of AMPA-accelerated release.
(A) AMPA has no effect on release from isolated cones. Top: Images of a dissociated cone photoreceptor from a FM1-43 loaded anole retina; brightfield (left), fluorescence (center), and overlay of both images (right). Dye fluorescence is localized to the synaptic terminal (arrow). Scale bar = 10 µm. Bottom: Release rate from cones in 20 µM AMPA (n = 6) is the same as in control cones without AMPA (n = 6). (B) AMPA accelerates release in thick, but not thin, retinal slices. Top: Fluorescence image of a retinal slice, loaded with FM1-43 prior to slicing. Bottom: 20 µM AMPA has no effect on release in thin (200 µm) slices (n = 9) but accelerates release by ∼2.5-fold in thick (500 µm) slices (n = 10). (C) Specific laser ablation of the HC layer disrupts AMPA-accelerated release. Top: Fluorescence image of a 500 µm-thick slice after laser ablation of either the region of the INL containing HC bodies (left) or the center of the IPL containing processes of other retinal neurons (right). Bottom: Ablation of the INL (n = 11), but not the IPL (n = 6), disrupts AMPA-induced release. Scale bar = 100 µm in (A) and (B). Laser-ablated regions extend 600 µm laterally along the surface of the slice.

