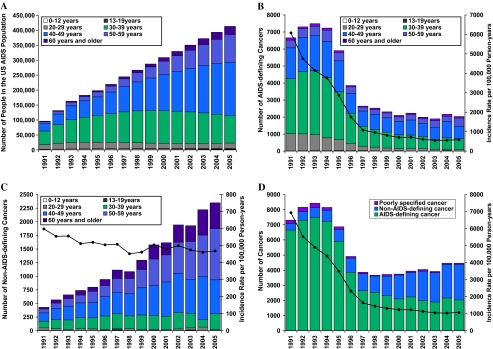
Figure 1.
Number of people living with AIDS, AIDS-defining cancers, non-AIDS-defining cancers, and all cancers in the United States during 1991–2005. A) US AIDS population by calendar year and age group. B) The estimated counts and standardized rates of AIDS-defining cancers among people living with AIDS in the United States by calendar year and age group. C) The estimated counts and standardized rates of non-AIDS-defining cancers among people living with AIDS in the United States by calendar year and age group. Of note, the bars for 0–12 year olds in panels (B) and (C) are difficult to see because of small numbers of cancers in this age group during 1991–2005 (122 AIDS-defining cancers and 25 non-AIDS-defining cancers). D) The estimated counts and standardized incidence rates of total cancers among people living with AIDS in the United States, stratified by AIDS-defining cancers, non-AIDS-defining cancers, and poorly specified cancers. Bars depict the estimated number of cancers, and points connected by lines depict incidence rates standardized to the 2000 US AIDS population by age group, race, and sex.

