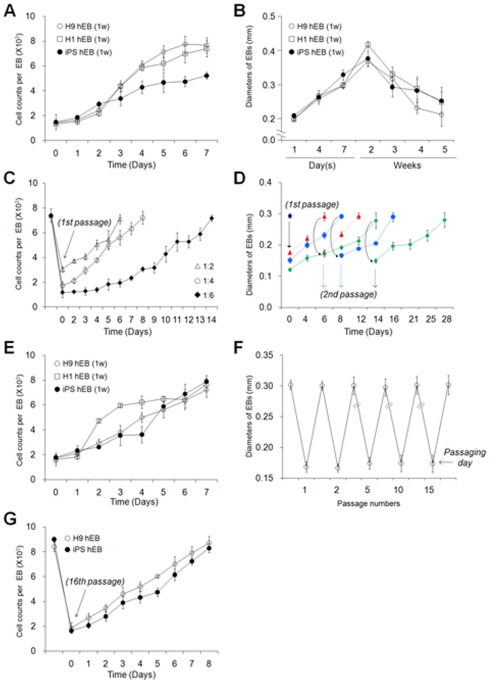
Figure 2. Size and number of hEBs under various culture conditions.
The growth curves were determined either by counting the average number of cells per hEB or by measuring the mean diameter of each hEB. (A) hEB cell counts during the first week of incubation. Step 1 culture shown in Fig. 1A . (B) Diameters of the hEBs during long-term culture without passaging. Step 1(1 to 7 days) and Step 2 (1 to 5 weeks) cultures shown in Fig. 1A . (C) Cell counts for the passaged H9 hEBs. (D) Diameters of the passaged H9 hEBs. hEBs were passaged at ratios of 1∶2, 1∶4, and 1∶6 (C and D). (E) Cell counts for hEBs that were passaged five times. hEBs were passaged at a ratio of 1∶4. (F) Diameters of the H9 hEBs during 15 continuous serial passages. hEBs were passaged at a ratio of 1∶4. The results represent the mean values (± SEM) of samples obtained from a representative experiment performed in triplicate. w: week, p: passage. Arrows indicate the passaging day (C, D, and F). (G) Cell counts for hEBs that were passaged 16 times.

