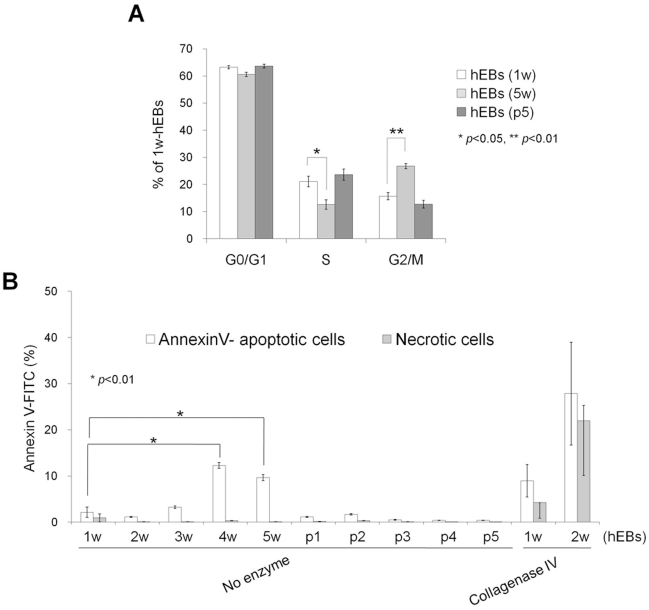
Figure 4. Cell-cycle and apoptosis analysis of hEBs.
(A) Cell-cycle analysis of hEBs using propidium iodide staining. The percentages of cells in G1, S, and G2/M are depicted in the graph representing the means ± SEM (n = 3). (B) Apoptosis analysis of hEBs using annexin-V/PI staining. hEBs were formed either with or without enzymatic treatment (collagenase IV) and maintained either with (p1, p2, p3, p4, and p5) or without passaging (1 w, 2 w, 3 w, 4 w, and 5 w). Values shown in the graphs represent the mean ± SEM (n = 3).

