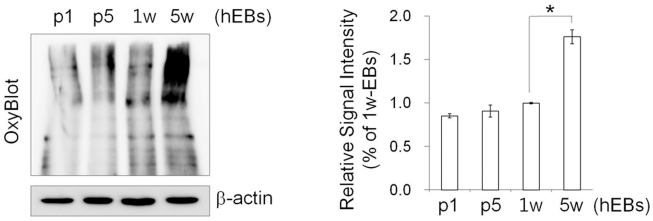
Figure 5. Protein oxidation assay in hEBs.
Left: Representative image for the OxyBlot assay, which detects the level of proteins with oxidative modifications. Right: For protein quantification, the blots were scanned, and the bands were quantified by densitometry. The data represent the mean ± SEM (n = 3).

