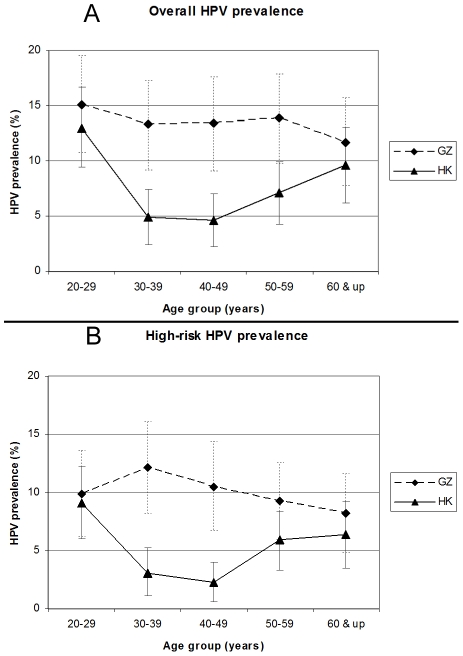
Figure 1. Comparison of the age-specific overall and high-risk HPV prevalence in five age-groups in the HK and GZ cohorts.
(A) Overall HPV prevalence: significant difference in the overall HPV prevalence between the two cohorts in age-groups of 30–39, 40–49 and 50–59 (p<0.001, p<0.001 and p = 0.007, respectively, z test). (B) High-risk HPV prevalence: significant difference in the high-risk HPV prevalence between the two cohorts in age-groups of 30–39 and 40–49 (p<0.001 and p<0.001, respectively, z test). The error bar indicates 95% confidence interval.

