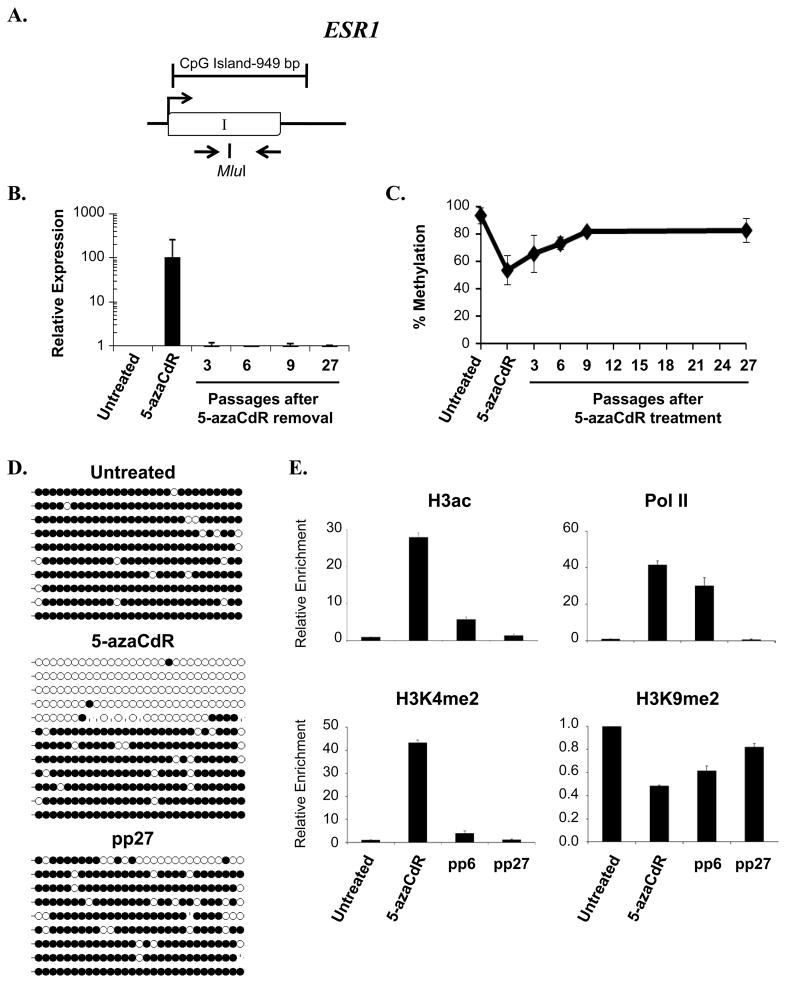
Figure 5. Analysis of ESR1 during and following treatment with 5-azaCdR.
A. Diagram of ESR1 CpG island. Open boxes, exons; arrow, transcription start site. The position of primers used for methylation analyses and the Mlu1restriction enzyme site used for COBRA analysis are indicated. B. mRNA expression was determined using primers specific to ESR1. Shown is the fold change in expression (mean ± standard deviation) relative to untreated cells after internal normalization to 18S rRNA from three independent experiments assayed in triplicate. C. COBRA analysis of DNA methylation at time points following the removal of 5-azaCdR at the ESR1 locus as described in the legend to Figure 1 D. DNA methylation was analyzed by bisulfite sequencing at the indicated time points. Each line represents a single colony isolate (9–12 isolated per sample). Open circles, unmethylated CpG; filled circles, methylated CpG. pp, passages post 5-azaCdR treatment. E. Histone modifications and RNA Pol II occupancy were determined by ChIP as described in the legend to Figure 2. Plotted is the mean (±standard deviation) of the fold change in enrichment relative to untreated MDA-MB231 cells from a single time course experiment assayed in triplicate. Similar results were obtained from a second independent time course (Supplemental Figure 3).

