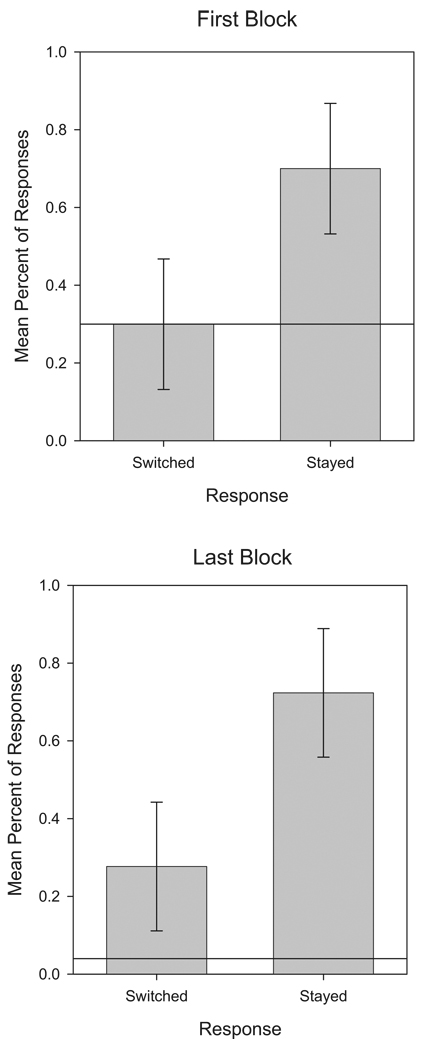
Figure 5.
Proportion of switching (left bars) and staying (right bars) responses, averaged across all human participants in Condition 2 of Experiment 3. The top panel represents the first 50 trials, and the bottom panel represents the final 50 trials. Error bars represent 95% confidence intervals. Reference lines show the probability of switching by pigeons during the first (top panel) and final (bottom panel) days of training in Experiment 2.

