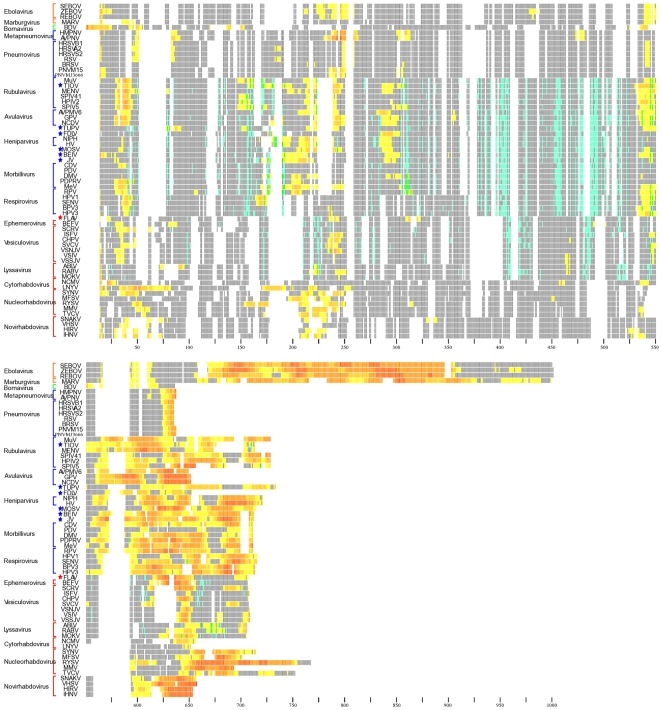
Figure 3. Entire Order Disorder and CICP mapped residues on the MSA.
All sequences analyzed in the study were aligned using the process described in the methods and put into order according to phylogenetic tree results (Fig. 1). Each residue is represented by a colored column tick corresponding to Disorder, CICP, both Disordered and CICP or neither a CICP or Disordered residue. Disordered residues are colored by an increase from yellow, being lowest confidence of disorder, to red, highest confidence of residue disorder. CICPs are shown in blue. Residues predicted to be both Disordered and a CICP are highlighted in green. Residues that have neither a Disorder or CICP prediction are represented in grey. Gaps in the alignment are represented in white. The black ticks at the bottom of the alignment denote residue position and occur every 25 residues. The color of the brackets to the left of the alignment indicate virus families: Bornaviridae, green, Filoviridae, orange, Paramyxoviridae, blue and Rhabdoviridae, red. Unassigned viruses are denoted by stars colored by the family they are unassigned in.

