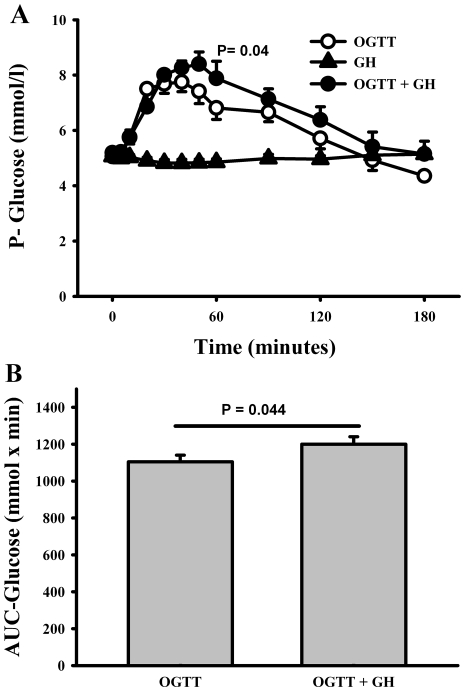
Figure 2. Glucose measurements.
(A) Plasma levels of glucose. OGTT, oral glucose tolerance test (75 g glucose). GH, growth hormone bolus (0.5 mg). Black circles = OGTT + GH, white circles = OGTT, black triangles = GH. Data are presented as mean ± SE. Using ANOVA repeated measurements showed a significant difference between OGTT and OGTT+GH (p = 4) (B) AUC-glucose, area under glucose curve. P-value is based on paired t-test between area under curve for OGTT and area under curve for OGTT+GH. Data are presented as mean ± SE. There was a significant difference in AUC-glucose between OGTT and OGTT+GH (p = 0.04).

