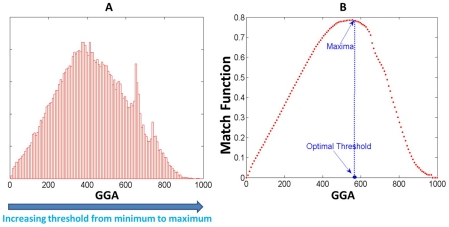
Figure 4. Determination of the threshold for PPI assignment by OLF.
This figure illustrates the procedure of computing optimal threshold for PPI assignment. Figure (A) displays the histogram of global geometric affinity (GGA). Figure (B) displays the value of match function at different threshold. The optimal threshold for GGA corresponds the one with the maxima of match function.

