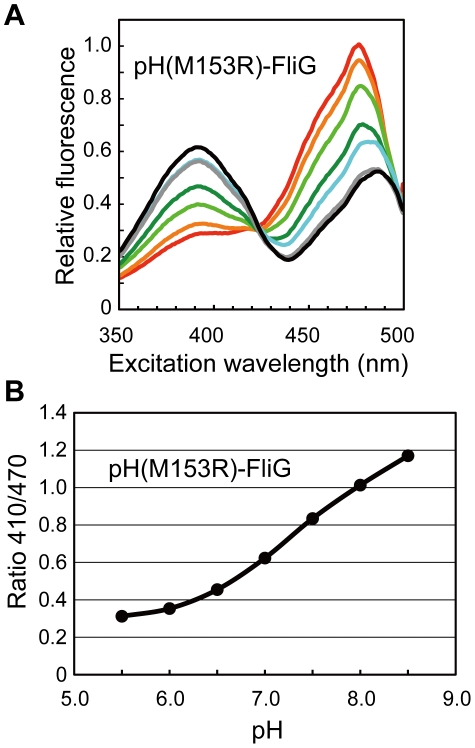
Figure 4. pH dependence of fluorescence excitation spectra and Ratio410/470 of pHluorin(M153R)-FliG-His6.
(A) Fluorescence excitation spectra. The different colored lines refer to different pH values. red, pH 5.5; orange, pH 6.0; light green, pH 6.5; green, pH 7.0; cyan, pH 7.5; grey, pH 8.0; black, pH 8.5. (B) Ratio410/470. The fluorescence excitation spectra of the purified protein were recorded on a fluorescence spectrophotometer. The measurements were done at 23°C.

