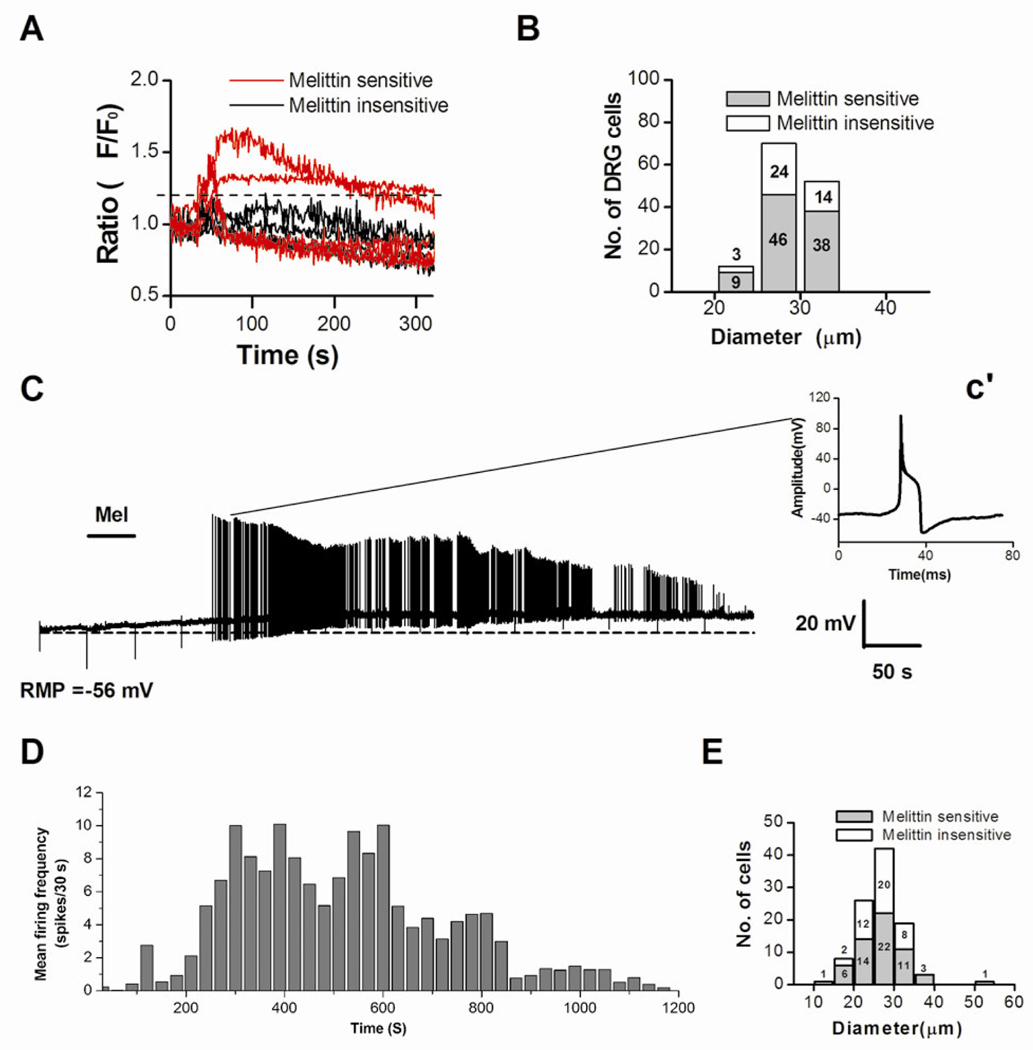
Figure 1. Melittin (Mel)-induced rise in intracellular Ca2+ concentration ([Ca2+]i) and action potential firing in DRG neurons.
A: Graph shows that a subpopulation of acutely isolated rat DRG neurons were able to respond to Mel (2.0 µM) with a [Ca2+]i rise (red vs. black). Typical traces of [Ca2+]i changes were simultaneously recorded during the application of Mel for 30 s. B: Distribution histogram of the cell body sizes for Mel sensitive (n=93) and Mel insensitive (n=41) DRG neurons. C: Application of Mel (2.0 µM, for 50 s) to a DRG cell evoked a slow membrane depolarization (resting membrane potential, RMP = −56 mV before melittin application; dotted line) and a period of tonic AP discharge. Inset c’ shows the waveform of the AP recorded at the indicated time, 133 seconds after the melittin application. D: Histogram showing time course of firing frequency averaged from 45 melittin-sensitive DRG neurons. E. Distribution histogram of cell body diameters for Mel-sensitive (n=56) and Mel-insensitive (n=46) DRG neurons as measured in current clamp experiments.

