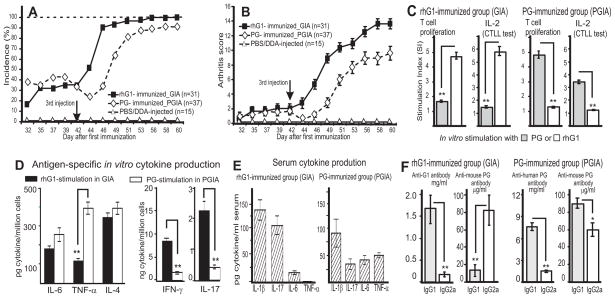
Figure 2.
Comparison of disease development and immune responses in mice with GIA and PGIA. A, Incidence and B, severity of arthritis in BALB/c mice immunized with either rhG1-Xa-mFc2a fusion protein (40 μg G1/injection) or cartilage PG (100 μg/injection) isolated from osteoarthritic cartilage (11,17,47). Vertical arrows indicate the third injection administered on day 42. Each animal was scored for arthritis three times a week, and the scores are shown as mean ± SEM. C, T-cell proliferation and IL-2 production in response to stimulation with rhG1 or PG. D, In vitro antigen (rhG1 and human PG)-induced cytokine production by spleen cells isolated from mice with GIA and PGIA, respectively. (E) Serum levels of cytokines and (F) anti-PG antibodies in mice with GIA and PGIA. The results shown in panels C-F are mean values ± SEM. Asterisks indicate statistically significant differences (*p < 0.05 and **p < 0.01).

