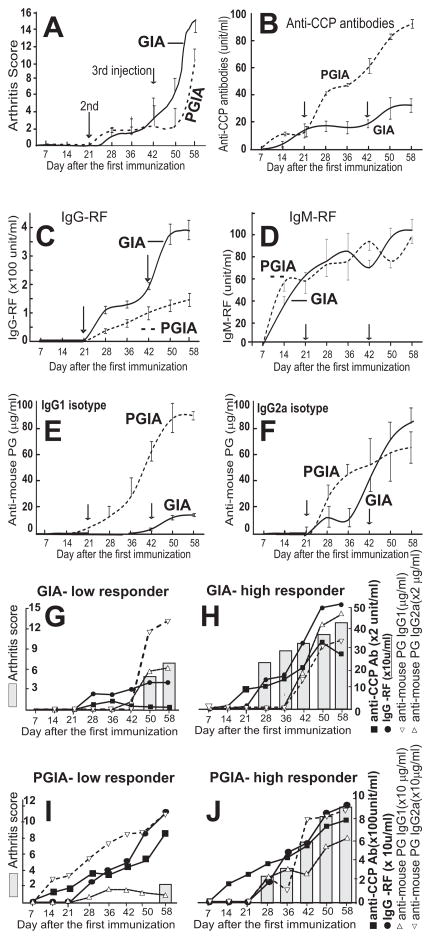
Figure 4.
Kinetics of autoantibody production in the context of arthritis development in GIA (rhG1-immunized) and PGIA. Arthritis scores (A), and serum levels of anti-cyclic citrullinated peptide (CCP) antibodies (B), rheumatoid factors (IgG- and IgM-type RF) (C, D), and autoantibodies to mouse cartilage PG (E, F) were monitored in rhG1- and PG-immunized mice between days 7 and 58 of immunization. Results from 17 mice with GIA and 14 mice with PGIA are shown. Panels G-J show individually analyzed arthritis scores and corresponding autoantibody titers in low and high responder mice in the GIA and PGIA groups. Although the results for only one low and one high responder mouse from each group are compared here, similar results were obtained in a replicate experiment. Note, the right y-axis scales in panels G, H, I, J are different from those shown in panels B, C, E, F.

