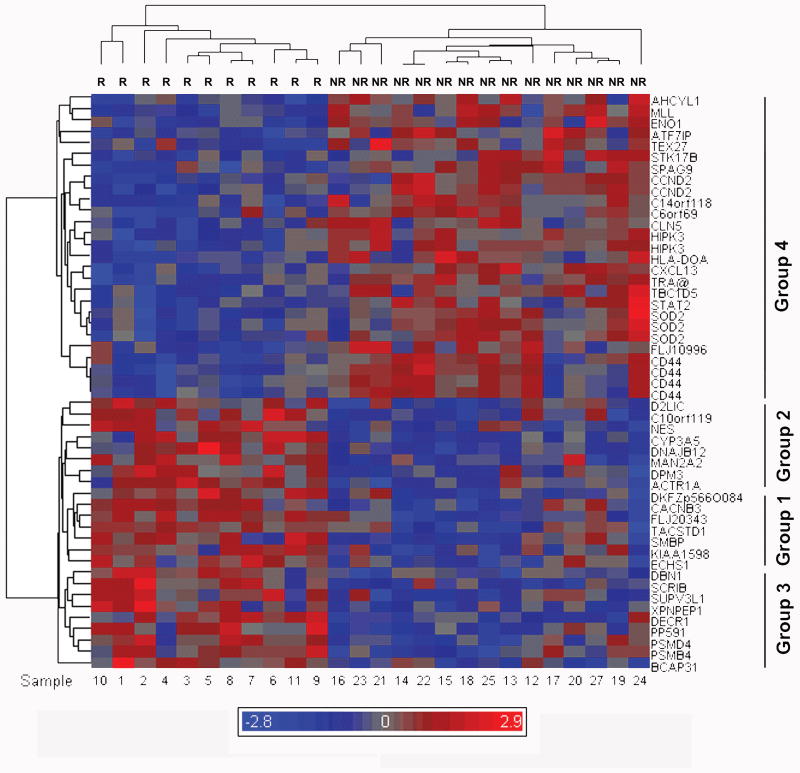
Figure 1. Gene expression profile and hierarchical clustering separating the recurrent and non-recurrent groups on the basis of discriminatory genes.
Twenty six evaluable tumors were clustered hierarchically on the basis of 51 probes corresponding to 44 genes, using Partek ® Genomics Suite v6.3. The dendrograms of individual patient samples and overall patterns of gene expression data are exhibited. The recurrent group is labeled R and non-recurrent NR. Individual tumor specimen numbers are indicated at the bottom of the figure and the tumor specimen dendrogram is given along the top. Gene symbols are indicated on the right side of the figure and relatedness of gene expression is indicated by the dendrogram on the left side of the figure. The clustering is of log2 transformed Affymetrix MAS5 signals. Red color indicates increased expression and blue color lower, relative to the mean level of gene expression, indicated in grey. The color scale indicates the mean log2 expression level above (red) and below (blue) the mean of all genes (grey), over a range of 2.9 log2 units above and below the mean.

