
Figure 10. In vivo molecular resonance imaging [MRI] of WT and Tg mice.
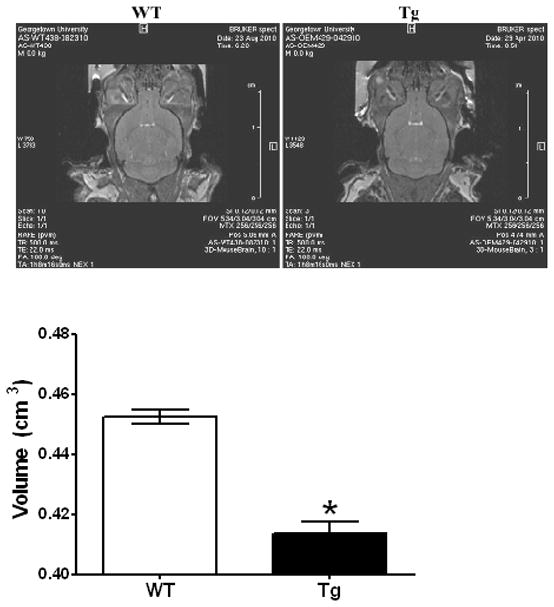
Volumetric measurements after in vivo MRI were performed as described in Methods with the use of Paravision 4.0 software by defining threshold values that segmented brain mass from structures such as the ventricles and determining the pixels and area corresponding to brain on each slice. Data are the averages from two mice in each group [18–22 months of age], while the image is representative from each animal species. [*, P < 0.05] compared to age-matched WT animals.