
Figure 7. Immunostaining of TH neurons.
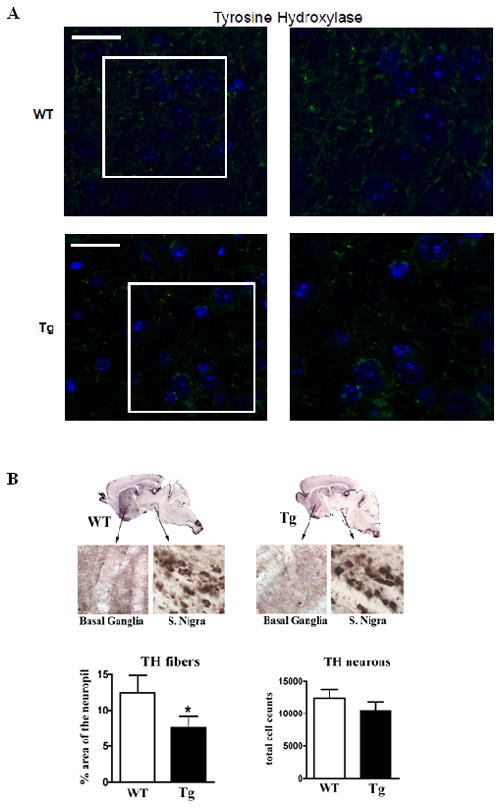
Immunostaining of transgenic [Tg] and wild type [Wt] mice was conducted as described in Methods. [A] Staining for TH (Green), DAPI (Blue) at lowest magnification (left) to highest magnification (right). White boxes highlighted on left panel indicate areas shown at higher magnification in right panel(s). Scale bar: 10uM. [B] TH-positive neurons in coronal sections of transgenic and wild type mice were analyzed. The data are from 6 mice each [12 months of age]. The counts in the SN were done by sterology, and no significant differences were found between transgenic and wild type mice.