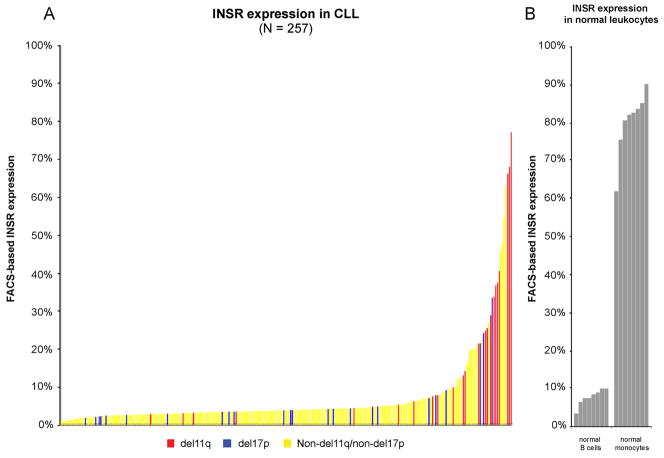
Figure 2. FACS-based INSR expression measurements in a large CLL cohort.
A: INSR expression was measured in duplicate in gated CD19+/CD5+ cells from PBMCs from 257 patients. Background staining was quantified based on isotype controls (see methods). Displayed are net INSR expression values for individual cases ranked by the magnitude of INSR expression. CLL cases with del11q or del17p present in ≥25% of nuclei are marked in red and blue. B: INSR expression in normal B-cells and monocytes.

