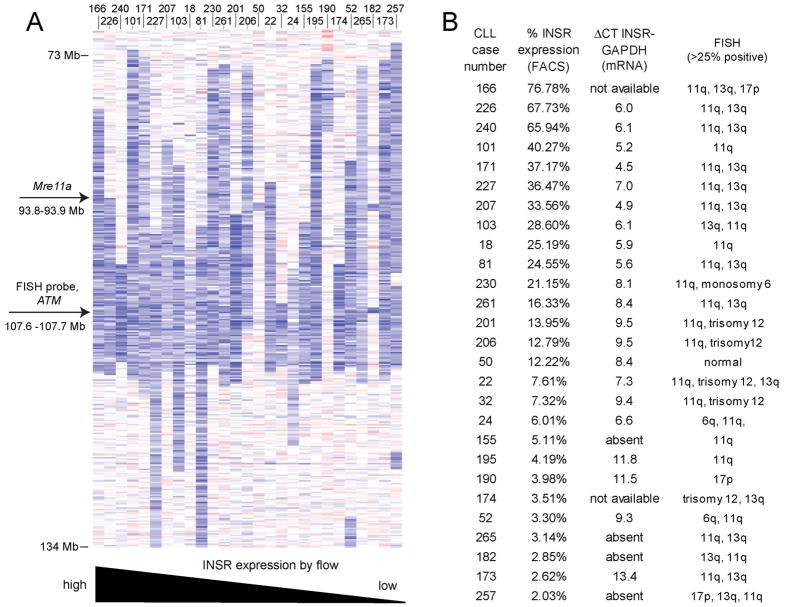
Figure 3. The anatomy of 11q deletions in CLL does not explain differences in INSR expression.
A: Heatmap display of copy number estimates for parts of chromosome 11 (blue: copy loss; red: copy gain) based on SNP 6.0 array profiling. The location of the ATM-centric FISH probe used clinically is indicated. Cases are ordered by degree of INSR expression. B: Summary of Q-PCR-based normalized INSR mRNA levels (ΔCt INSR-GAPDH values) and FACS-based INSR protein expression levels for the CLL cases with 11q deletions marked in panel A.

