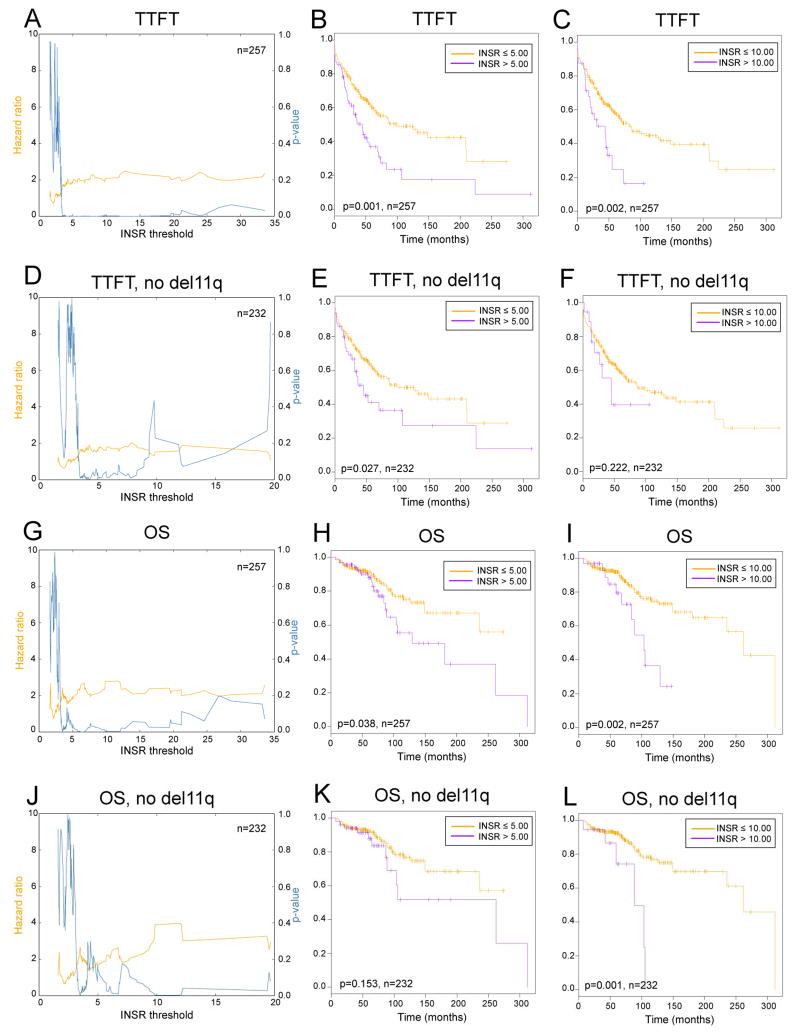
Figure 5. Higher INSR expression is associated with elevated hazard ratios for CLL disease progression or short OS over a broad range of actual INSR expression values.
Displayed are hazard ratios (yellow) and corresponding p-values (blue) as a function of various INSR protein thresholds measured through FACS. A-C: TTFT and various INSR thresholds (all cases). D-F: TTFT and various INSR thresholds (all cases minus 11q cases). G-I: OS and various INSR thresholds (all cases). J-L: OS and various INSR thresholds (all cases minus 11q cases).

