
Figure 1.
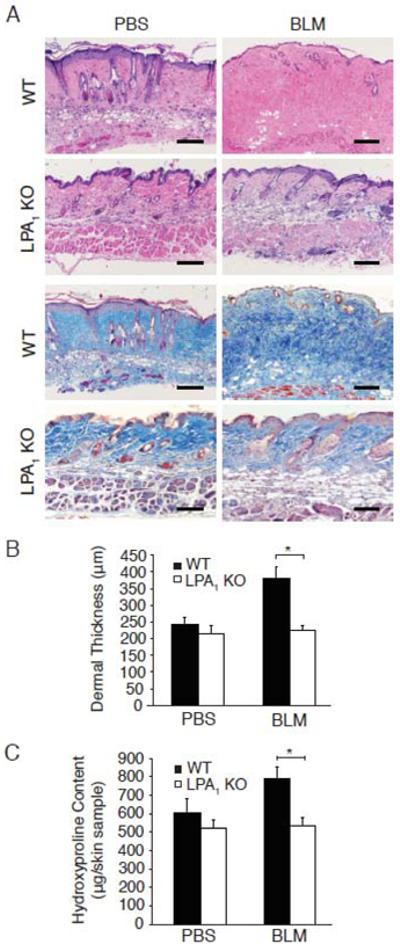
LPA1 KO mice are protected from bleomycin-induced dermal fibrosis. (A) H&E (upper panels) and Masson’s trichrome staining (lower panels) of the skin of WT and LPA1 KO mice following PBS or BLM challenge. Magnification x100; bar, 100 μm. (B) Dermal thickness measured in 5 locations/HPF, in 10 HPF/skin sample, *p<0.001, BLM-challenged WT vs. LPA1 KO mice; p<0.02, WT-BLM vs. WT-PBS mice. (C) Skin hydroxyproline content, *p<0.001, BLM-challenged WT vs. LPA1 KO mice; p<0.01, WT-BLM vs. WT-PBS mice. Data are from one of two experiments with similar results, each with n ≥ 5 WT and LPA1 KO mice for both treatment groups. Data are expressed as mean dermal thickness ± SEM or mean hydroxyproline content/6 mm punch biopsy skin sample ± SEM, respectively.