
Figure 3.
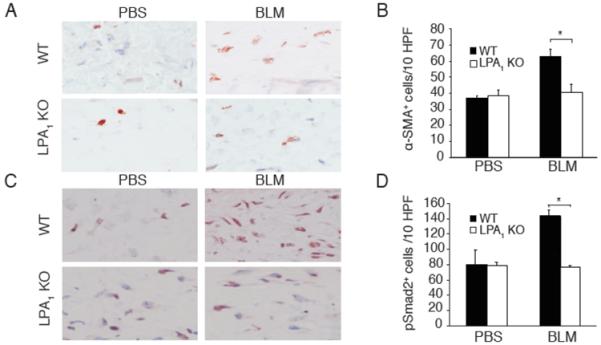
Bleomycin-induced accumulation of α-SMA+ myofibroblasts and phosphoSmad2+ cells is diminished in LPA1 KO mice. (A) Skin of WT and LPA1 KO mice following PBS- or BLM-challenge stained with anti-α-SMA antibody (magnification x400). (B) Quantification of α-SMA+ cells in dermis of WT and LPA1 KO mice following PBS or BLM challenge. Data are from one of two independent experiments with similar results, each with n = 6 WT and LPA1 KO mice for both treatment groups, and are expressed as mean number of α-SMA+ cells per 10 HPF ± SEM (*p<0.01, WT-BLM vs. LPA1 KO-BLM; p<0.001, WT-BLM vs. WT-PBS; LPA1 KO-BLM vs. LPA1 KO-PBS was not significant). (C) Skin of WT and LPA1 KO mice following PBS or BLM challenge, stained with anti-phosphoSmad2 (pSmad2) antibody (x400). (D) Quantification of pSmad2+ cells in dermis of WT and LPA1 KO mice following PBS or BLM challenge. Data are from one of two independent experiments with similar results, each with n = 3 WT and LPA1 KO mice for both treatment groups, and are expressed as mean numbers of pSmad+ cells per 10 HPF ± SEM (*p<0.002, WT-BLM vs. LPA1 KO-BLM; p<0.03, WT-BLM vs. WT-PBS mice, LPA1 KO-BLM vs. LPA1 KO-PBS mice was not significant).