
FIGURE 1.
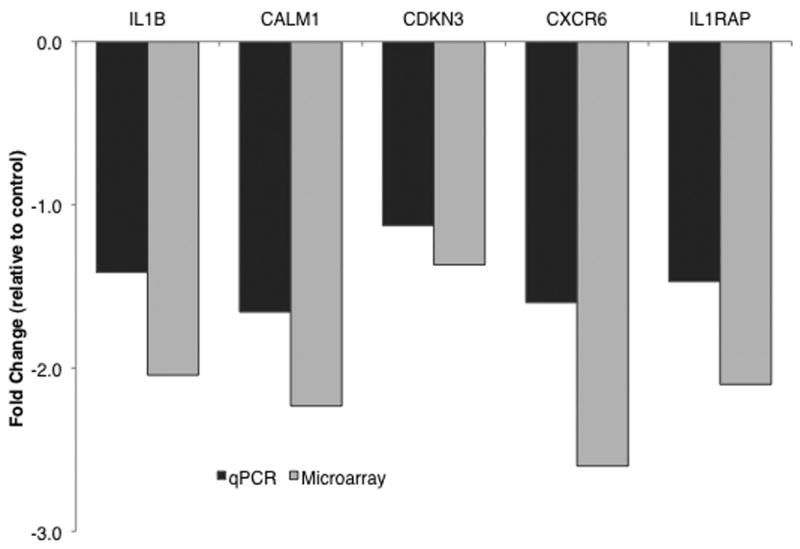
Gene expression as evaluated by microarray and qPCR. Fold change values represent difference in gene expression with AVP treatment compared to expression with saline treatment (r4=0.921, p=0.026). Negative values represent down-regulation of gene expression. IL1B = interleukin 1 beta, CALM1 = calmodulin 1, CDKN3 = cyclin-dependent kinase inhibitor 3, CXCR6 = C-X-C chemokine receptor type 6, IL1RAP = interleukin 1 receptor accessory protein.