Figure 1.
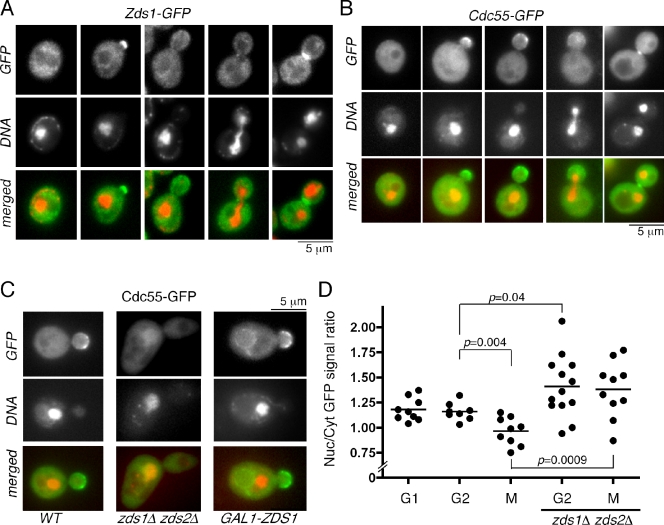
Localization of Zds1 and Cdc55. (A) Cell cycle localization of endogenous Zds1-GFP. Cells were fixed with formaldehyde and stained with DAPI. (B) Cell cycle localization of endogenous Cdc55-GFP. In live cells, DNA was stained with Hoechst 33258. (C) Nuclear localization of Cdc55-GFP is affected in zds1Δ zds2Δ cells and in the cells overexpressing Zds1 (GAL1-ZDS1). (D) Nuclear accumulation of Cdc55-GFP is prevented by Zds1 and Zds2. The ratio of mean fluorescence intensity of nuclear (Nuc) and cytoplasmic (Cyt) Cdc55-GFP in each individual cell was plotted. Horizontal lines indicate means. n = 8–13 for each category. G1, unbudded cells; G2, budded with a single nucleus; M, large budded cells with dividing or divided nuclei. P-value was calculated by Student’s unpaired t test.

