Figure 1.
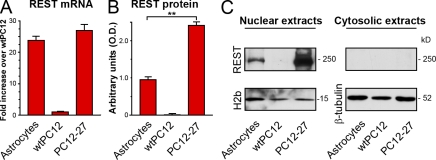
Expression and intracellular distribution of REST in cultured astrocytes and PC12 cell clones. (A) The levels of REST mRNA in cultured astrocytes that are much higher than those of wtPC12 and similar to those of the high REST PC12 clone PC12-27. Error bars indicate SEM. (B and C) Western blot results concerning the 225-kD band (C) decorated by the Millipore anti-REST pAb. Proteomic analyses (to be reported elsewhere) demonstrated the 225-kD band to contain only REST; other major bands, also decorated by the pAb (not depicted), were shown to contain unrelated proteins. The astrocyte REST protein levels, ∼40% of those of PC12-27 cells, are shown in B (**, P < 0.01; error bars show SD). C shows the REST Western blots of the nuclear and cytoplasmic extracts of the three cell types, revealing the concentration of the REST protein in the nucleus (left) with inappreciable levels in the cytoplasm (right). Data are from three experiments performed in triplicate.

