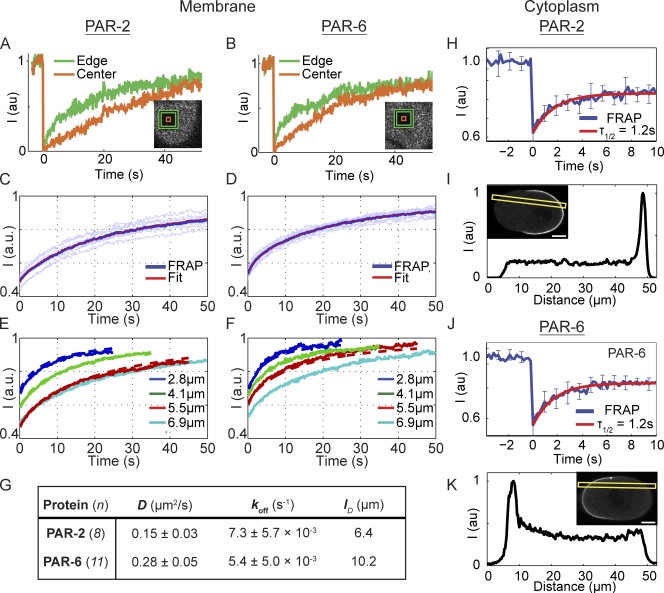
Figure 1.
PAR-2 and PAR-6 kinetics revealed by FRAP. (A and B) A comparison of the recovery at the edges versus the center of bleached boxes on the embryo surface reveals a clear outside-in pattern for both proteins that is characteristic of lateral diffusion. (C and D) Mean, normalized FRAP data (blue line) for a 6.9 × 6.9–µm box were well fit by a diffusion and exchange model (red line) using the measured coefficients in G. Light blue lines show individual replicates. (E and F) Recoveries into boxes of varying size are accurately predicted using the measured coefficients. Note that the larger boxes recover more slowly, consistent with recovery through diffusion. (G) Measured diffusion and binding coefficients for PAR-2 and PAR-6. Mean ± SD is shown. (H) FRAP of PAR-2 in the cytoplasm of embryos exhibited a halftime of recovery of ∼1.2 s for a 9 × 9–µm square bleached at the embryo midplane. Mean ± SD of individual recoveries is plotted (n = 8). (I) No obvious gradient of GFP–PAR-2 was visible when embryos were imaged in a cross section using confocal microscopy. Fluorescence along the A–P axis along the indicated yellow box is shown. (J and K) Same as H and I, but for GFP–PAR-6. Again, cytoplasmic recovery is rapid and no significant gradient is seen. Bars, 10 µm.

