Figure 2.
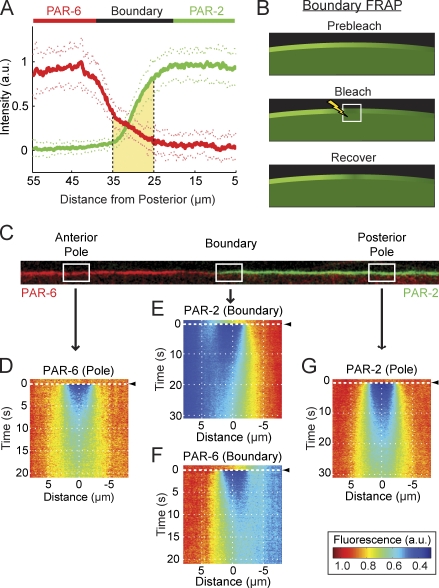
PAR proteins diffuse across the domain boundary. (A) Quantification of PAR protein distributions during maintenance phase. The levels of PAR-6 (red, left) and PAR-2 (green, right) are relatively homogenous within the anterior and posterior domains, respectively. At midcell, proteins localize to opposing spatial gradients, which overlap (shaded yellow region). Mean ± SD is shown (n = 20 anterior to posterior profiles, 2 each from 10 embryos). Note that distances are represented relative to the posterior pole, with positive distance toward the anterior. (B) A schematic of boundary FRAP. The white box with the lightning bolt indicates the bleached region. (C) An example of a computationally straightened membrane profile from an embryo expressing GFP–PAR-6 (red) and mCherry–PAR-2 (green) in which the boundary gradient and polar regions are indicated. (D–G) For bleaching, embryos expressing GFP–PAR-6 or GFP–PAR-2 were subjected to FRAP within a 4-µm-long box at the approximate positions indicated. Fluorescence profiles were captured along the membrane at each time point, and recovery data were averaged for experiments performed at each position (n > 14). To facilitate visualization, data were assembled into kymographs with time on the y axis. Bleaching occurred at t = 0 s, indicated by black arrowheads. Distance is on the x axis and is expressed relative to the center of the bleached population. At the anterior (D, PAR-6) and posterior poles (G, PAR-2), recovery is symmetric. In contrast, within their respective boundary gradients (E, PAR-2; F, PAR-6), recovery is asymmetric, with recovery from the domain-proximal boundary being much greater than that from the boundary distal to the domain.

