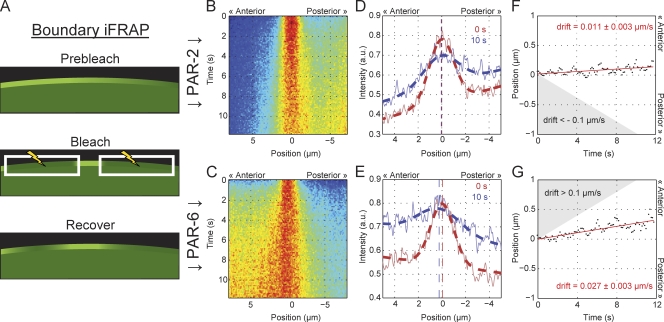
Figure 3.
PAR proteins exhibit minimal drift within the boundary gradients. (A) A schematic of boundary iFRAP. White boxes with lightning bolts indicate bleached regions. (B–G) Embryos expressing GFP–PAR-6 or GFP–PAR-2 were subject to bleaching of the gradient with the exception of a 4-µm-long box, leaving a small unbleached population. As in Fig. 2, fluorescence profiles were captured along the membrane at each time point and assembled to form the kymographs shown. Time is on the y axis. Distance relative to the center of the unbleached population is on the x axis with positive distance toward the anterior. Data are averaged from multiple experiments (n > 11). (B and C) Kymographs reveal that the unbleached fluorescent population spreads outward from the center over time. At later time points, fluorescence returns throughout the gradient as molecules diffuse into the imaged region from unbleached portions of the embryo, and molecules undergo membrane–cytoplasmic exchange. These processes will eventually tend to distort the distribution. (D and E) Fluorescence distributions (solid lines) and the resulting fits (dashed lines) for the distribution of unbleached molecules at 0 s and 10 s after bleach. The fit peaks of the distribution of unbleached molecules are indicated by vertical dashed lines for each time point. (F and G) Plotting the position corresponding to the peak of unbleached distribution over time shows that although some drift is evident, the rates of drift are much below what would be minimally required to counteract diffusive flux. The predicted required levels are indicated here by the shaded regions, which indicate drift velocities that exceed 0.1 µm/s up the respective gradient. Note that the estimated drift velocity (slope of the red line) for PAR-2 and PAR-6 is opposite relative to their respective gradients, indicating that both drift slightly toward the anterior.

