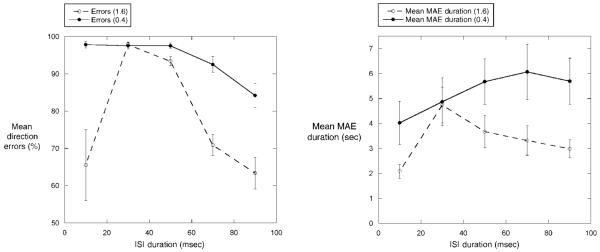
Figure 3.
Results of Experiment 1 (left) on direction discrimination and Experiment 2 (right) on MAE duration as a function of ISI duration. Filled symbols represent results using a grating frequency of 0.4 cpd, and open symbols show results using a grating frequency of 1.6 cpd. Discrimination results are plotted as the mean number of response errors at each ISI duration, ±1 SE. Chance performance is 50%. MAE results are plotted in terms of mean MAE duration (in sec) at each ISI duration, ±1 SE.

