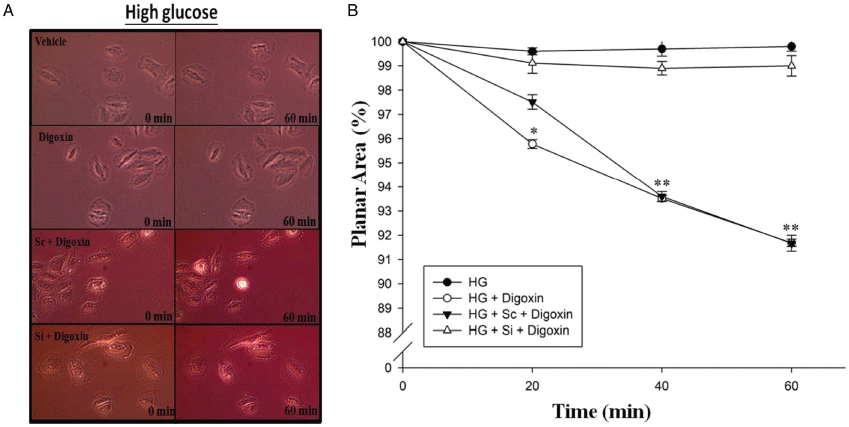
Figure 5.

Effects of PPARδ-specific siRNA on digoxin-induced cell contraction in HG-treated H9c2 cells. The HG-treated H9c2 cells were incubated with siRNA-PPARδ (Si) or siRNA-control cells (Sc) for 48 h before incubation with 1 µmol·L−1 digoxin for 30 min and then applied for measurement of the planar surface area. The upper panel (A) shows the representative change of cells in each group. The lower panel (B) expresses the differences between four groups as mean ± SEM (n = 6 per group). Both digoxin-treated group and Sc treated with digoxin group were markedly different compared to the controls (*P < 0.05 and **P < 0.01).
