
Figure 6.
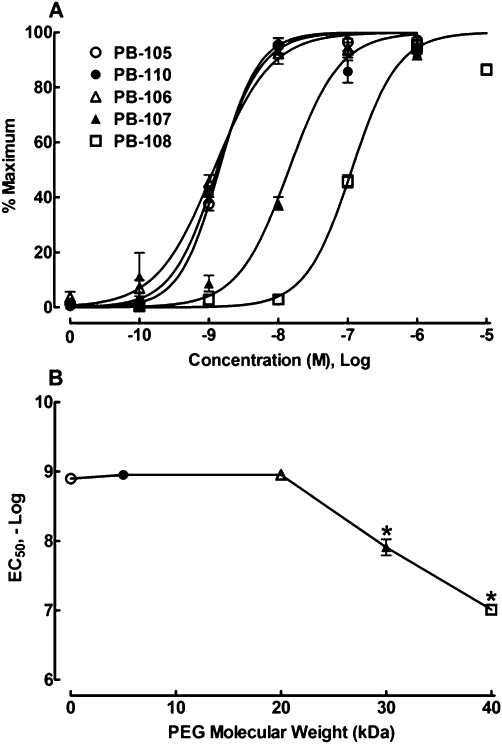
Concentration–response curves for the effect of PB-105 (ExC39) and its PEGylated analogues on intracellular cAMP in PC12 cells (A) and the relationship between PEG mass (kDa) and potencies of PB-105 and its PEGylated analogues (B). PEGylated analogues conjugated with different molecular masses of PEGs: PB-110 (ExC39PEG5kDa) with PEG5kDa, PB-106 (ExC39PEG20kDa) with PEG20kDa, PB-107 (ExC39PEG30kDa) with PEG30kDa and PB-108 (ExC39PEG40kDa) with PEG40kDa. Concentration–response analysis was best fitted by a non-linear least-squares method. All the readings are means ± SEM of triplicate results, repeated two to three times. *Denotes statistically significant difference compared with PB-105 treatment (P < 0.05 by a two-way anova followed by post hoc Student-Newman-Keuls test).