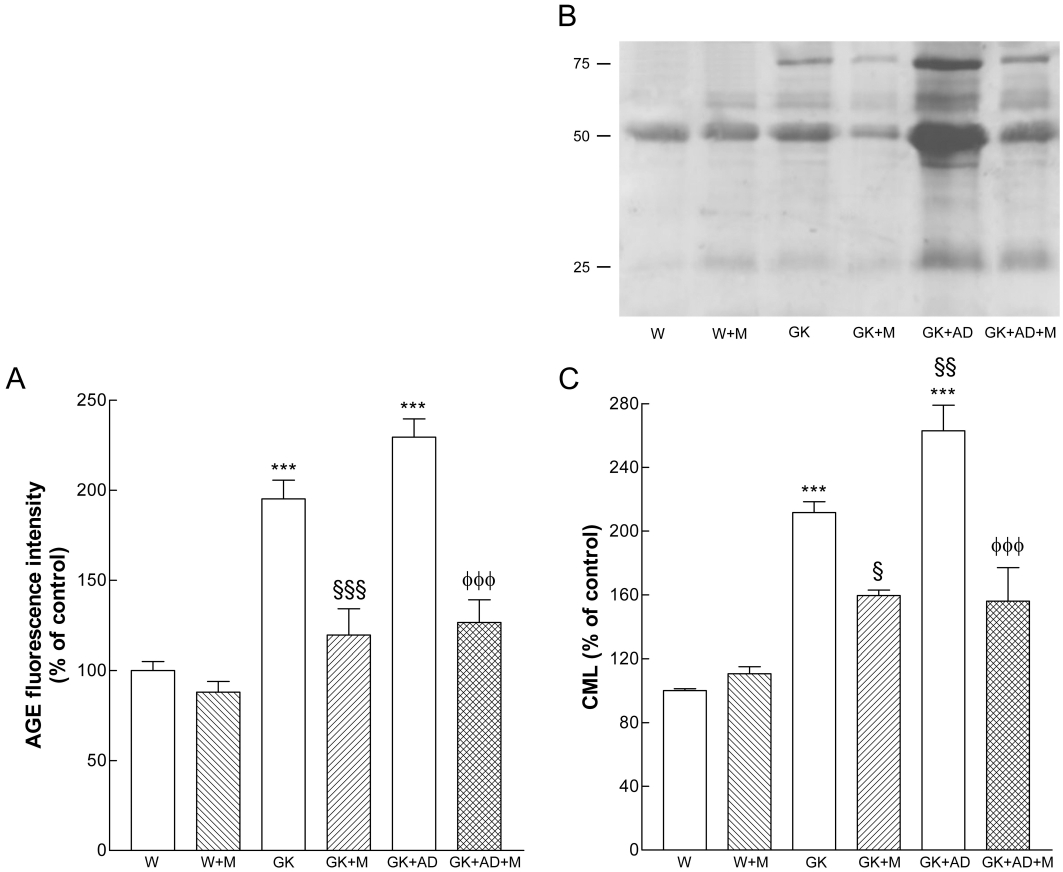
Figure 7.

Effects of metformin on AGE levels in Wistar and diabetic GK rats fed with normal and AD diet. (A) Plasma fluorescence AGE intensity as a percentage of elevation over the control value (set to 100%). (B) Representative Western blot analyses of carboxymethyl-lysine (CML) expression in aortas of the different groups of arteries. (C) Averaged densitometric data for W + M and diabetic groups expressed as a percentage of elevation over the control value established as 100%. Data are mean ± SE. ***P < 0.001 versus Wistar group; §P < 0.05, §§§P < 0.001 versus GK control group; φφφP < 0.001 versus GK + AD group.
