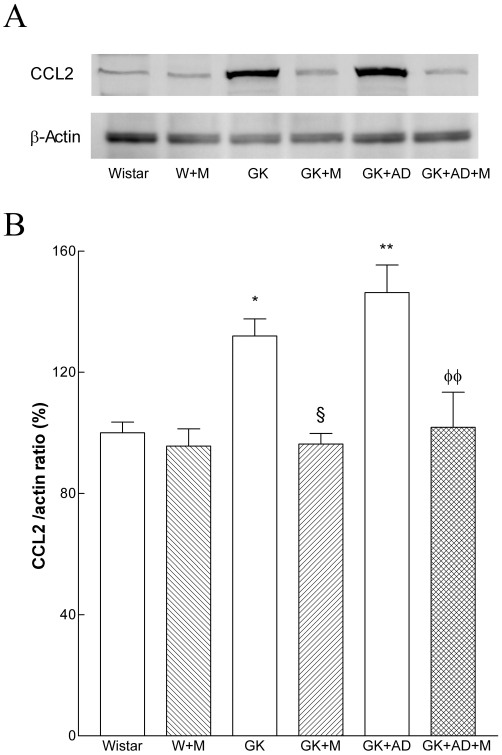
Figure 8.

Effects of metformin on aortic contents of the chemokine CCL2 in Wistar and diabetic GK rats fed with normal and AD diet. (A) Representative Western blot analyses of CCL2 expressed in aortas of the different groups of rats. (B) Averaged densitometric data for W + M and diabetic groups expressed as a percentage of elevation over the control value (set to 100%), after first normalizing against actin. Data are expressed as mean ± SE. *P < 0.05, **P < 0.01 versus Wistar group; §P < 0.05 versus GK control group; φφP < 0.01, versus GK + AD group.
