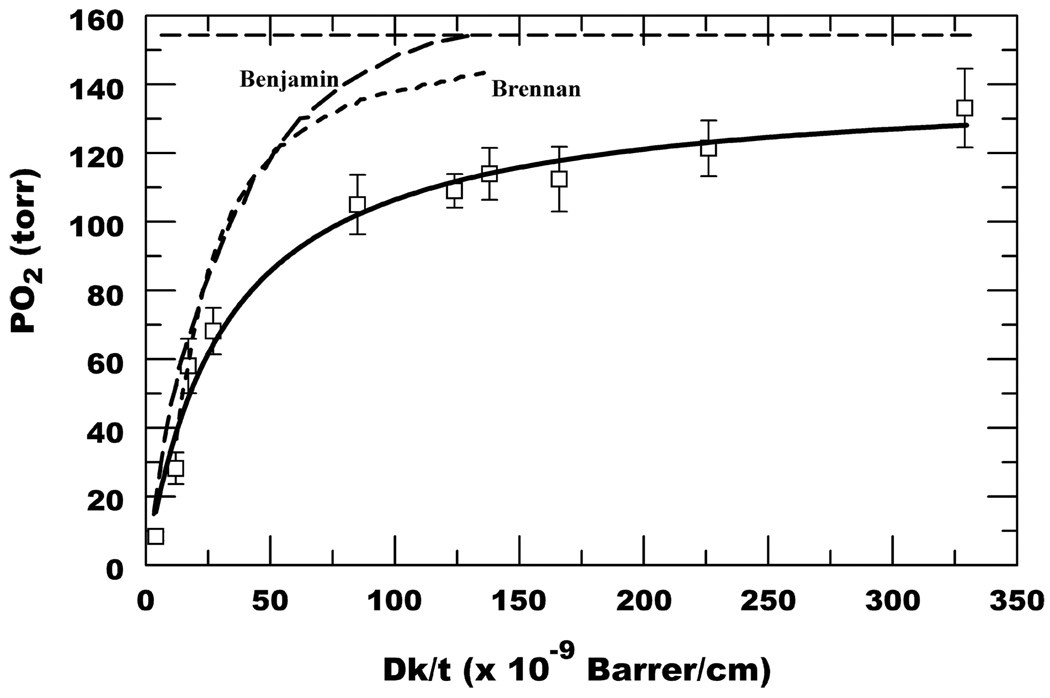
FIGURE 1.
Open eye SS PO2. Data are mean ± SD (n = 15); also includes polymacon lenses (Dk/t = 4.2 and 12).11 Solid line is a hyperbolic fit, PO2 = a × (Dk/t)/[b + (Dk/t)], where a = 140.6, b = 32.1. Benjamin curve from (ref. 14). Brennan curve from (ref. 9). Horizontal dashed line represents 155 torr.

