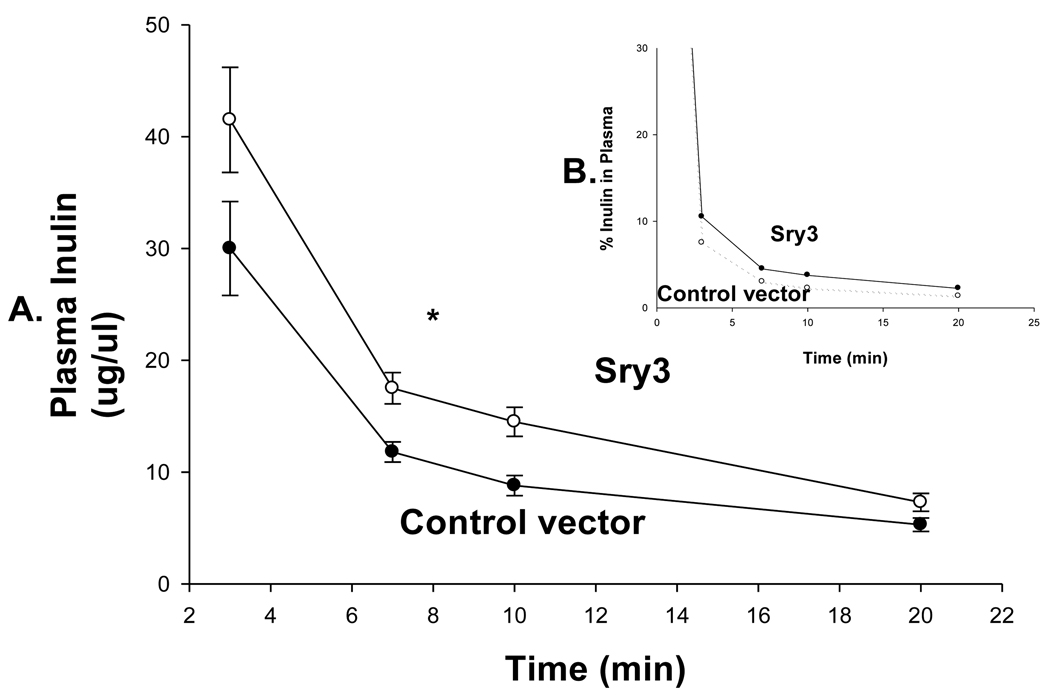
Figure 5.
A. Inulin clearance measured at day 21 over 20 minutes in control vector (open squares, n=6) and Sry3 (solid squares, n=6) rats and was significantly (33%) reduced for the Sry3 group compared to controls. The slope for inulin concentration between 3 and 7 minutes was 6.0 for Sry3 and 4.5 for control vector, p<0.05. The graph only extends to the 20 min point to better illustrate the slope difference (data at 55 min was same for both groups). B. Insert plots inulin as a function of the % remaining in plasma, broken line control vector and solid line Sry3. Two way ANOVA with repeated measures: treatment-F=3.99, p<0.05, time-F=118, p<0.001 and interaction of time and treatment-n.s.

