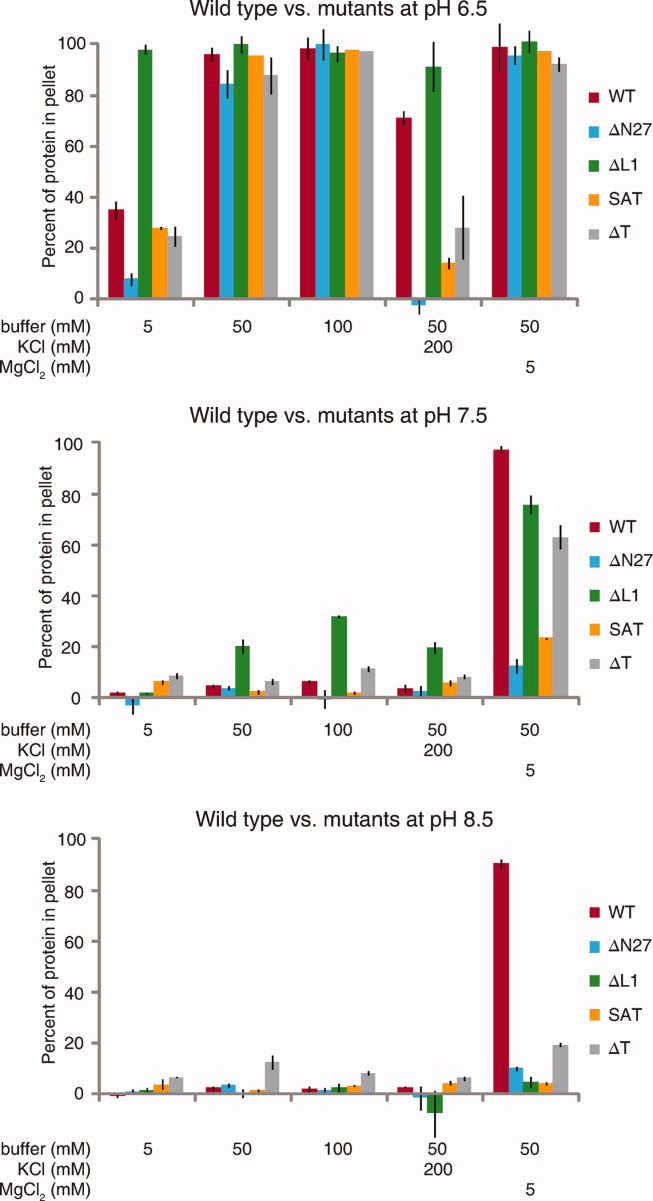
Fig 5.

Solubility of crescentin mutants. Comparison of wild-type and mutant solubility at pH 6.5, 7.5, and 8.5 under the noted conditions. Bars show the proportion of crescentin pelleted after centrifugation for 15 min at 135,000 × g. The average of three experiments is shown, and error bars represent SEM.
