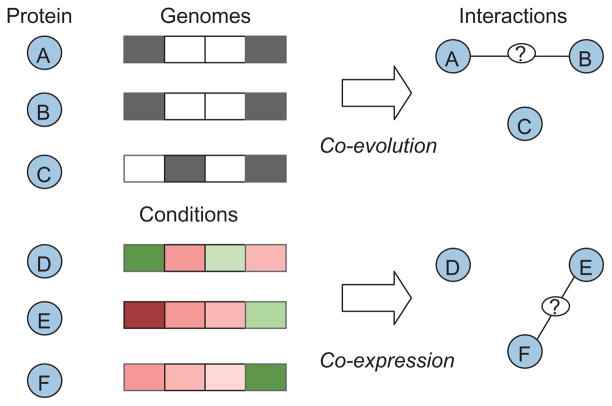
FIGURE 2.
Illustration of the general principles of common computational methods for predicting protein–protein interactions. In the upper panel, black and white boxes, respectively, indicate existence and absence of a homolog in the corresponding genome. In the lower panel, the red and green shades of boxes, respectively, indicate the degree of up- and down-regulation of the coding gene with respect to the corresponding condition.

