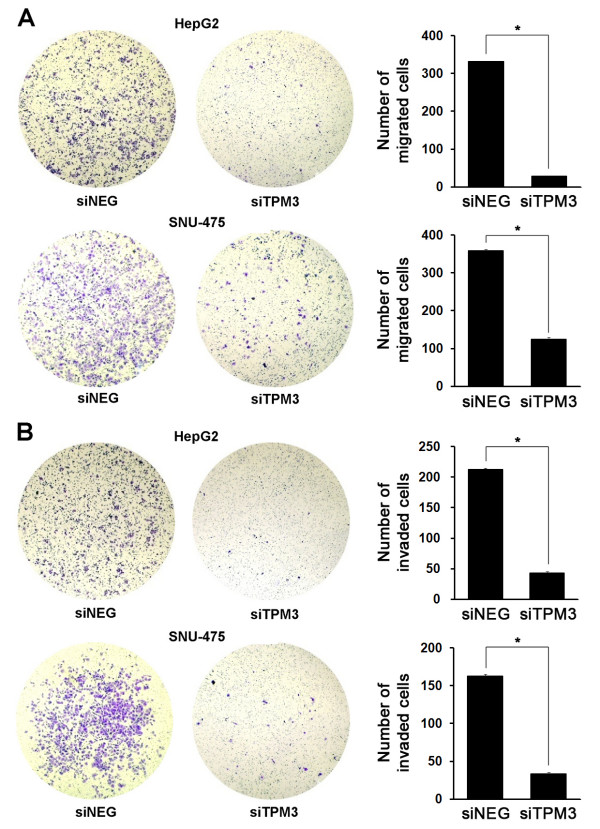
Figure 3.
Repressed migration and invasion in TPM3 knockdown HCC cell lines. (A) Migration of siTPM and siNEG transfected HCC cell lines was examined using the Matrigel uncoated transwell membrane. After crystal violet staining, the numbers of colonies in five microscopic fields (X200) were counted. In HepG2, 332.0 in siNEG-treated cells (95% CI 323.0-341.0) versus 29.3 in siTPM3-treated cells (95% CI 25.5-33.1), P < 0.0001; In SNU-475, 359.3(95% CI 350.6-368.1) versus 125.3(95% CI 114.1-136.5), P < 0.0001. (B) Invasion of siTPM and siNEG transfected HCC cell lines was examined using the Matrigel coated transwell membrane. In HepG2, 212.7 in siNEG-treated cells (95% CI 206.4-218.9) versus 43.0 in siTPM3-treated cells (95% CI 36.4-49.6), P < 0.0001; In SNU-475, 162.7(95% CI 156.4-168.9) versus 33.7(28.5-38.8), P < 0.0001. Error bars represent mean ± standard error of mean. * represents P value < 0.05.

