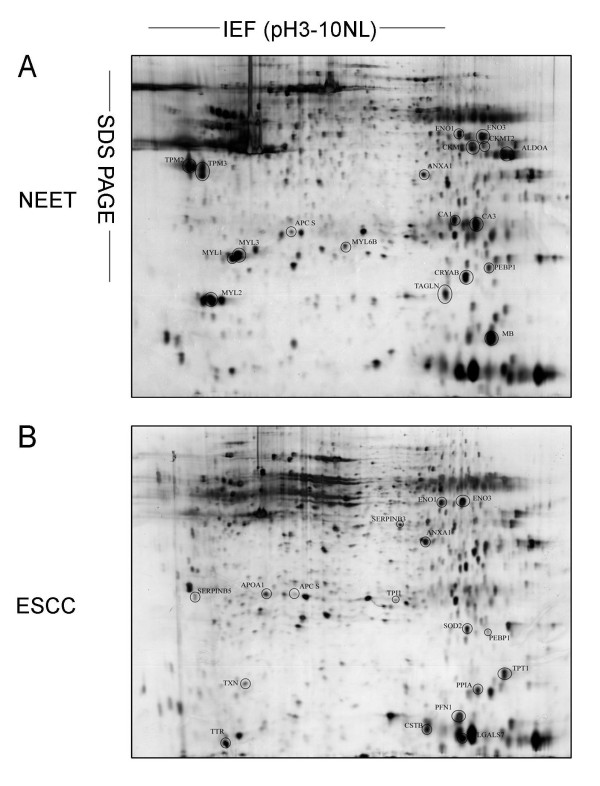
Figure 1.
Representative 2-DE protein profiles. 2-DE protein profiles of NEET (A) and ESCC samples (B). Proteins were separated on the basis of pI (X-axis) and molecular mass (Y-axis). A total of 250 μg protein was separated using 24 cm pH 3-10NL IPG strips (cup-loading method) and 12.5% SDS-PAGE. Proteins were visualized by silver staining. Differentially expressed proteins are indicated with black circles. These proteins were identified by MALDI-TOF/TOF MS, as summarized in Additional file 1.

