
Figure 5.
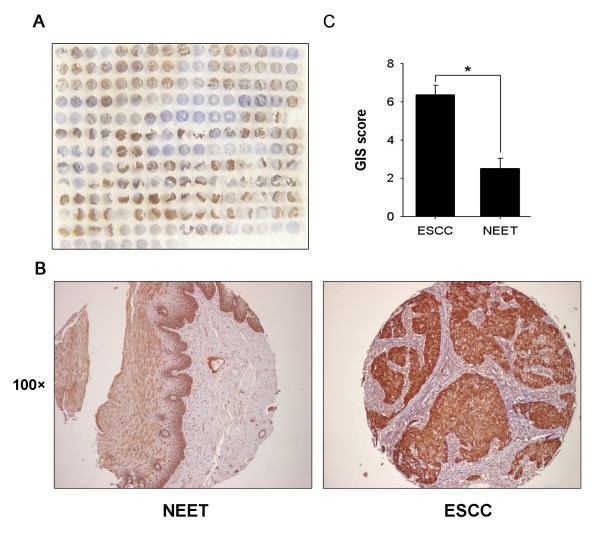
Tissue microarray analysis of galectin-7 expression. (A) Overview of the tissue microarray. (B) Representative example of galectin-7 expression in NEET (100×) and in ESCC tissues (100×). (C) Expression patterns of galectin-7 in NEET and ESCC were analyzed using the GIS score system. The differences in galectin-7 expression levels in ESCC and NEET were assessed by the Student's t-test (*P < 0.05) for unpaired values.