
Figure 1.
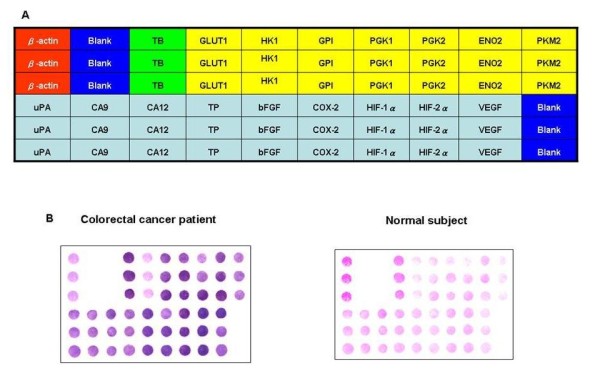
Schematic representation of membrane array and comparison of gene expression patterns between a human colorectal cancer patient (Case No. 6) and healthy control. (A) Schematic representation of membrane array with 16 target genes, one housekeeping gene (β-actin), one bacteria gene (TB), and blank control. Sixteen target genes (i.e., GLUT1, HK1, GPI, PGK1, PGK2, ENO2, PKM2, uPA, CA9, CA12, TP, bFGF, COX-2, HIF-1α, HIF-2α, and VEGF). The position of the correlation of the blank and positive control (β-actin) as well as the negative control (Mycobacterium tuberculosis; TB) in the nylon membrane are pointed out by spots. The relevant positions are the red area (β-actin), blue area (blank), green area (TB), yellow area (glycolysis-related genes), and pink area (hypoxia-related genes). (B) A triplicate set of 16 molecular markers for colorectal cancer was blotted on the nylon membrane. In addition, a housekeeping gene and a bacterial gene serving as positive and negative controls, respectively, were also blotted on the membrane.