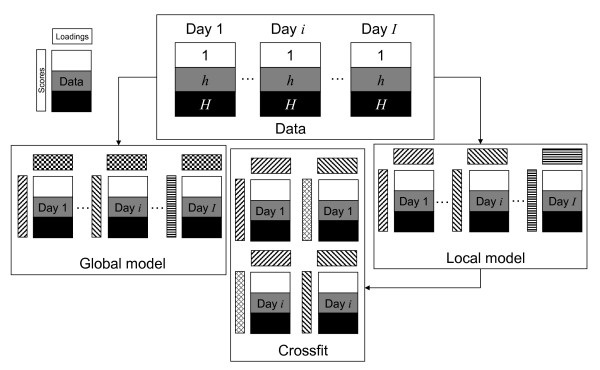
Figure 1.
Analysis scheme. Depiction of the described analysis approach: The data of the treatment groups h nd days re arranged into I matrices. These can be analysed using a global model (left), where the same loadings are fitted for every day i. In the local model (right), different loadings are fitted for each day. The scores on these loadings are subsequently determined in the crossfit (center). The figure shows a crossfit between days 1 and i, but this procedure is possible between all days in the experiment.

