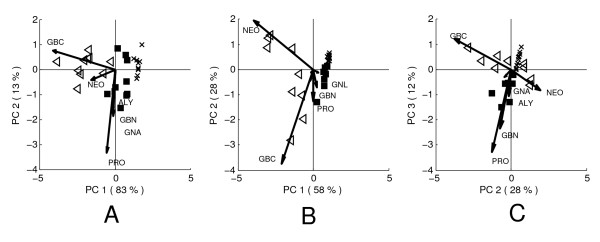
Figure 4.
Biplots of the local PCA models of the glucosinolate data. A) Day 1, PC 1 vs. 2, B) Day 7, PC 1 vs. 2, C) Day 7 PC 2 vs. 3; CON plants have been indicated by crosses, RJA plants by filled squares and SJA plants by open triangles. The arrows indicate the loadings and the loading labels indicate the corresponding glucosinolate species. The figure order corresponds to the modes of variation described by the global model components.

