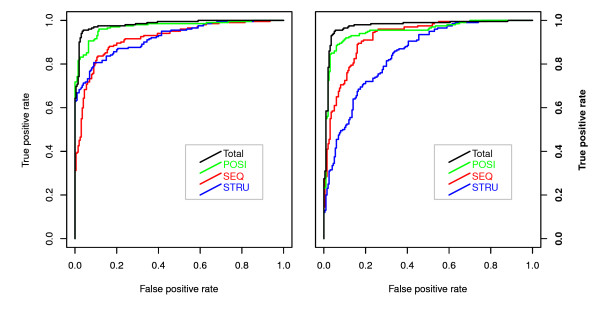
Figure 6.
ROC curves for miRNA-target interactions identified using Neg_1 and Neg_2. Models were developed using only 10, 11, 5 and 10 statistically significant sequences, structural and positional features and total features, respectively. ROC curves are used to evaluate and compare the performance of miRNA-target interactions identified for four different feature sets.

