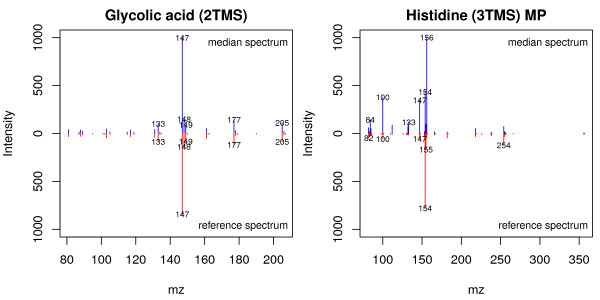
Figure 4.
Comparison between identified metabolite spectra and reference spectra. Comparison example between the averaged (blue) and reference spectra (red) of glycolic acid (right) and histidine (left). This type of comparisons can be used to assess the quality of individual identified peaks. In this example, histidine may need a closer inspection to elucidate what causes the difference.

