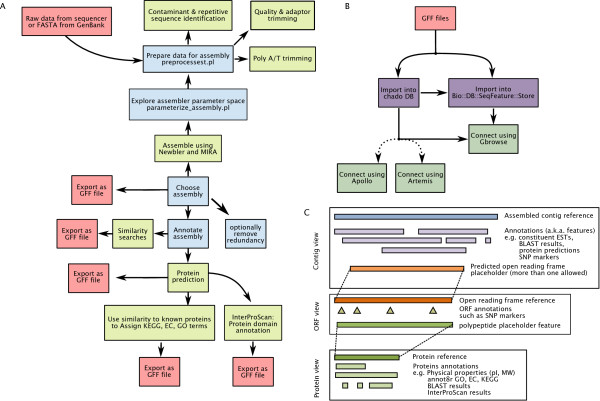
Figure 1.
Schematic diagram of the est2assembly platform. (A) Sub-routines processing and annotating the EST data. Note that all outputs are in the common GFF standard and therefore can be accessed by GMOD-compatible software. (B) Diagram illustrating the the ability of est2assembly to produce a GBrowse sequence view. (C) Diagram illustrating a triple page approach to graphical outputs from est2assembly: First, a page showing the assembled contig and associated annotation, second, a page showing each predicted ORF and its annotation and, third, a page focused around the annotated protein object. Note that each page is linked and allows for rapid navigation to genes of interest.

