Figure 6.
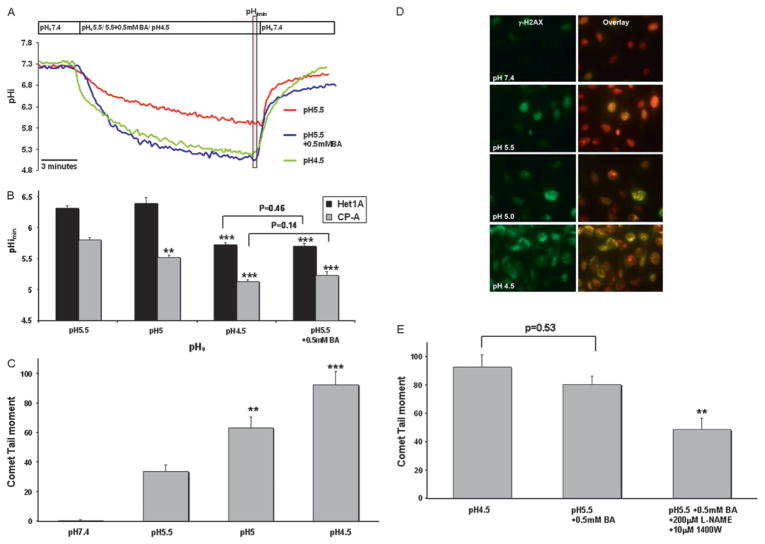
Acidification and DNA damage induced by acid and bile acids. (A) Representative pHi traces (pHe 5.5, 4.5, 5.5+0.5 mM BA) in CP-A cells measured by BCECF microfluorimetry. The vertical transparent red box indicates values used to quantify pHimin. (B) pHimin in HET1A and CP-A cells after treatment with medium at varying pHe and at pH 5.5 +0.5 mM BA. Asterisk indicates statistically significant difference compared to pH 5.5 (**p<0.01, ***p<0.001). (C) Median DNA tail moment in CP-A, measured by the comet assay, after 10 min treatment with medium at varying pH (***p<0.001, **p<0.01 compared to pH 5.5). (D) Representative images of γ-H2AX (green signal) in CP-A cells. Red signal represents nuclear staining. (E) Median DNA tail moment in CP-A cells after treatment with medium at pH 5.5, medium at pH 5.5 +0.5 mM BA and medium at pH 5.5 +0.5 mM BA + NOS inhibitors (**p<0.01 compared to pH 5.5+0.5 mM BA). BCECF, 2′,7′-bis(carboxyethyl)-5(6)-carboxyfluorescein.

