Figure 7.
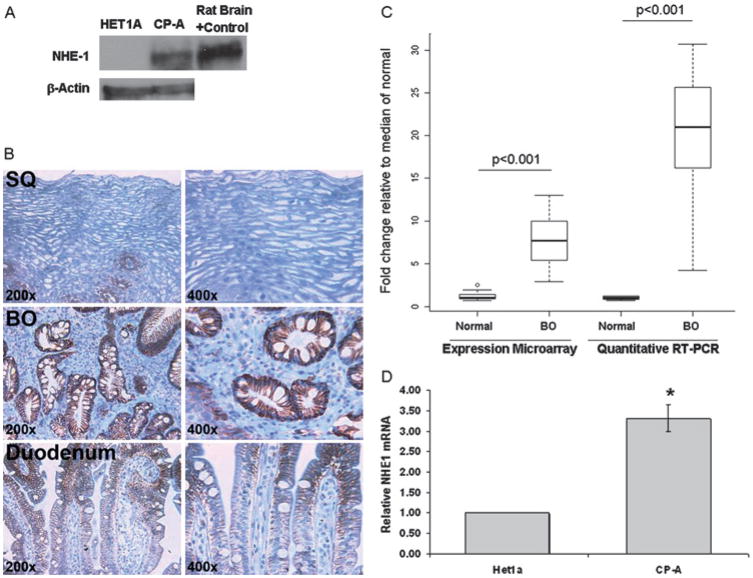
Evaluation of NHE1 in oesophageal cell lines and in human tissues. (A) A representative western blot of NHE1 and β-actin in HET1A and CP-A cells with rat brain as positive control. (B) Typical immunohistochemical staining of NHE1 in squamous epithelium (SQ), Barrett’s oesophagus (BE) and duodenum. (C) mRNA levels in normal squamous epithelium (SQ, N=13) and Barrett’s oesophagus tissues (N=18). Panel C shows boxplots of NHE1 expression measured by microarray analysis and RT-PCR in normal squamous epithelium (SQ, N=13) and Barrett’s oesophagus tissue (N=18). Results are shown normalised to the median of the normal squamous population for each technology. The p values for significant differences in NHE1 expression are shown. (D) Relative NHE1 mRNA levels in HET1A and CP-A cells.

