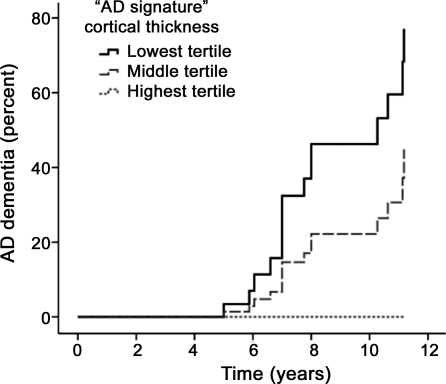
Figure 3. Alzheimer disease (AD)-signature MRI biomarker predicts time to dementia in people who were cognitively normal when scanned.
Univariate survival plot of predicted time to AD dementia for hypothetical average study participants with AD-signature cortical thickness in the lowest (smallest) tertile, middle tertile, and highest tertile. The displayed survival curves are therefore model predictions and do not directly represent subject results. AD-signature thickness was predictive of progression from normal cognition to AD dementia (hazard ratio 3.5 for 1 SD decrease in thickness; 95% confidence interval 2.0–6.4; p < 0.00005) in the model. The mean thickness of the lowest tertile was 1.1 standard deviations thinner than the mean of the entire group of all participants, the mean of the middle tertile was at approximately the mean of the entire group, and the mean of the highest tertile was 1.1 standard deviations thicker than the mean.

